
The most crucial element of a webinar is its audience, and to gain an audience, you need to analyze the statistics of every webinar you deliver.
How to measure statistics of a webinar?
Unfortunately, many organizers give post-webinar statistics far less attention than they deserve. After all, statistics allow you to evaluate your events’ attendance and the participant’s interest in the content. So, with its help, it will become straightforward for the webinar organizer to analyze the data for each user and adjust the material accordingly.
Everything about using webinar statistics
Webinars done properly keep growing an audience, which is reason enough to start analysing yours and paying attention to what the numbers say. The platform of MyOwnConference lets you do this in just a few clicks. Where each of these numbers sits in the panel is covered by webinar statistics and reports.
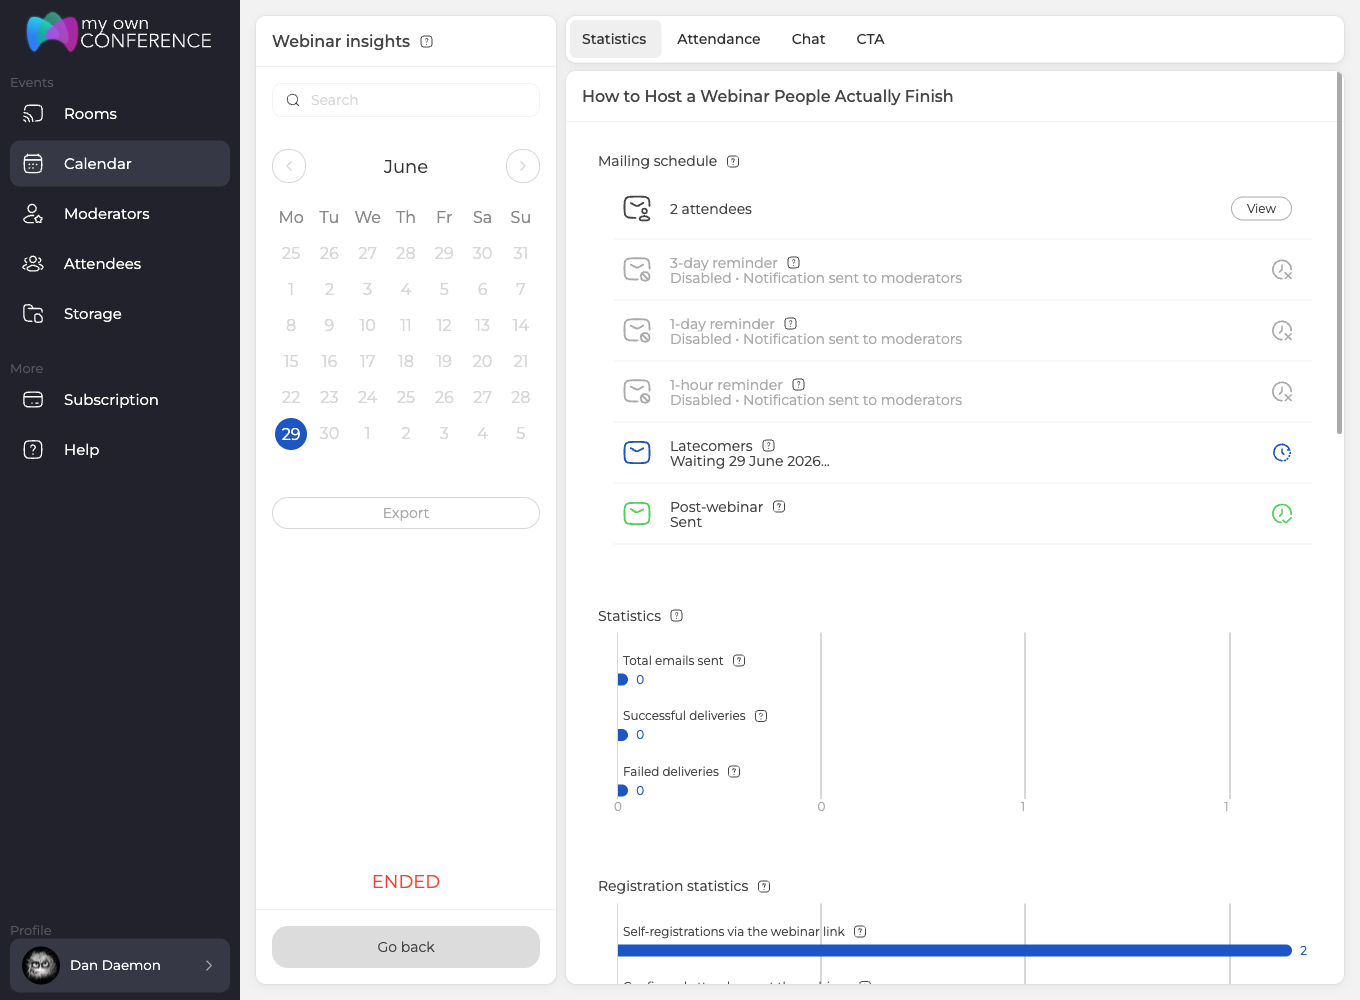
Our service provides a lot of information about online events. This can also be used in reporting, for example, to show the effectiveness of your webinar to superiors or potential clients during business meetings or sales pitches. On the other hand, statistics can be helpful for reflection, introspection and improvement of your work.
How to analyze webinar room occupancy?
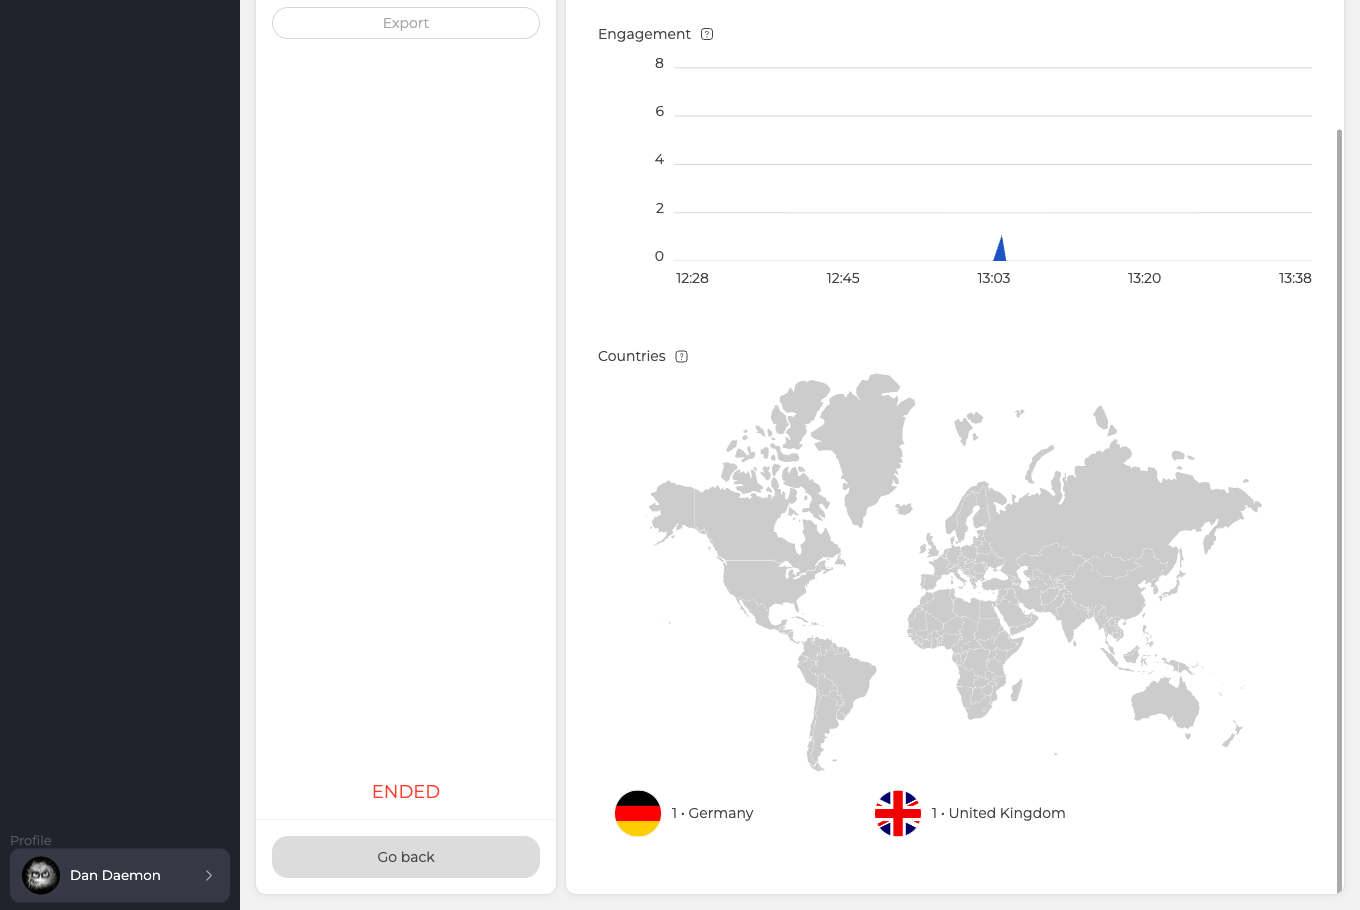
The "Engagement" chart in the picture follows how many attendees were in the webinar room minute by minute, so you can see when it was most occupied. Above it, the "Involvement" block puts the number of expected attendees next to the number who actually joined.
You can also use such information to determine the geolocation of your potential customers or the time zone that will be most convenient for most participants. This will also allow you to choose the language in which it is best to write invitations for potential attendees of your next webinar.
In addition, the "Statistics" block counts the emails that were sent, delivered and failed, while "Registration statistics" shows how many people confirmed or declined attendance. Together they tell you whether the invitations reached people and how people answered them.
How to extract chat history?
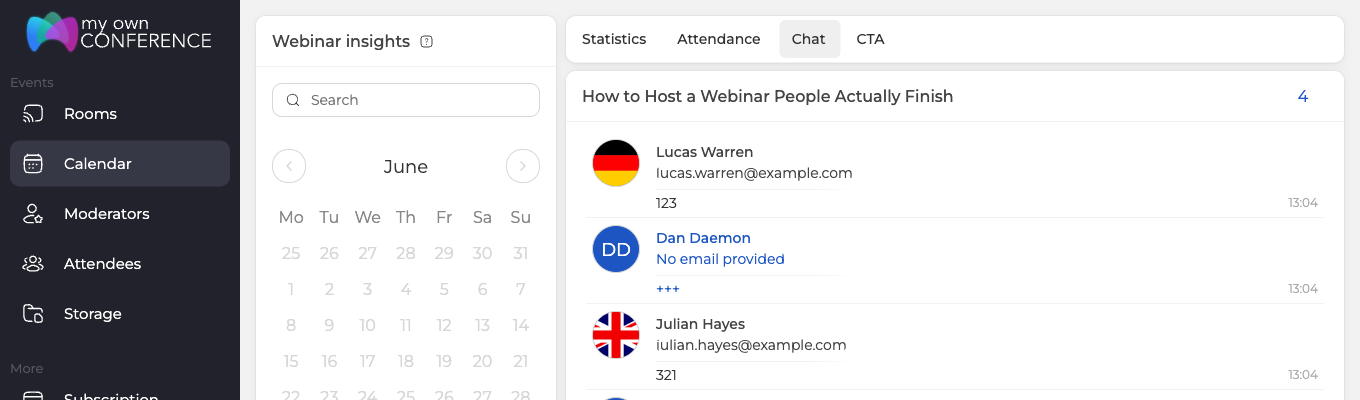
While analyzing the history of chats, you can do the following:
- Determine what users are most interested in
- Which users were more active
- Extract all the participants’ questions and answer them at the next webinar.
- Send the follow-up explanations from your own address, so they are less likely to land in spam.
The "Chat" tab lists the messages from the room together with the name of each author and the time they were sent. You can download all this information in both XLSX and CSV format.
Important note for everyone: Do not share any confidential information from these chats with third parties. Even though conversations should stay within a specific group of people, some participants might accidentally post details such as their location or phone number in the chat. Hackers could take advantage of this information for their own purposes. Because of that, make sure you do everything possible to keep the personal data of webinar participants fully protected.
How do you evaluate the history of entries and exits?
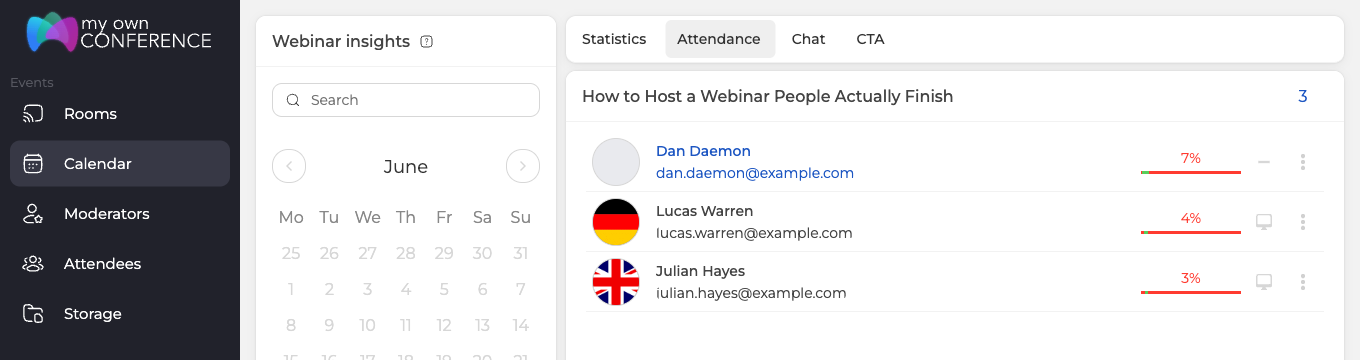
This section displays the exact number of users who attended the webinar, and the bar beside each name shows what share of the webinar that person spent in the room. Please note that when several participants enter a webinar from the same IP address, the Internet connection is divided by the number of connections. In this case, MyOwnConference does not guarantee the high quality of the sound and image of the webinar.
For a corporate event with several speakers on air, a connection of 50 Mbps or more leaves you comfortable headroom, and internet speed for the webinar room sets out the figure per presenter. Check your own line with the equipment tester.
You can also download the entry and exit history in XLSX and CSV format.
How to analyze the "Call To Action" stats?
Sales buttons are a direct way of promoting your product or service during the event. The collected statistics show the ratio of participants who attended the webinar to the number of clicks on a specific sales button.
Moreover, each button will have its statistics. You can learn more about buttons and how to use them in our article: CTA or Call To Action: calling the audience to action.
Here are some findings which we retrieved by analyzing hundreds of webinar statistics
1. Mid-week days are best for hosting a webinar
Surveys of webinar programmes agree that midweek draws the best turnout, with Tuesday, Wednesday and Thursday ahead of the rest, though which of the three leads changes from study to study. The figure usually quoted alongside them, an average of roughly 260 per webinar, counts sign-ups rather than people in the room. Only part of that list turns up on the day, and around 40% of registrants is the number most often reported.
2. Webinars should be 30 to 45 minutes long
According to BigMarker, 44% of webinar attendees prefer sessions that are 45 minutes long. However, 41% said they wanted them to be 30 minutes long. Only 10% said they would like to attend an hour-long webinar. Therefore, whenever you host a webinar, try to keep it within 30-45 minutes.
3. Only 40% of webinar attendees pay attention to the event from start to finish
According to Make Social Media Sell, an average of 40% of listeners focus on a webinar from start to finish. The rest, as a rule, eventually lose interest and leave the broadcast.
To keep your audience engaged, you need to create high-quality content. Here is how.
4. After the event is over, the audience may still show interest in you
A successful webinar should keep the participants hooked even after it ends. A recording collects most of its views in the first days after the broadcast and then tapers off, so the replay is worth promoting while interest is still fresh rather than weeks later. Click here to learn how to record your webinar.
5. Letting people watch straight away lifts attendance
Venture Harbour measured how many of its sign-ups actually turned up and found that only 20.56% of them did. The fix was not more promotion. Letting people watch almost immediately instead of waiting for a scheduled slot more than doubled the figure to 42.46%, and later changes to reminders and replays took it higher still.
Using MyOwnConference, you can also develop the tips and tricks for your specific webinar the same way and create your road map for success.
As of now, you are familiar with the importance of using statistics to deliver a successful webinar. So, without wasting any time further, join MyOwnConference and make your webinar dream come true!
Final thoughts on webinar statistics
These insights show how measurable webinar metrics can turn a simple online session into a powerful tool for audience engagement. By monitoring registration and attendance rates, tracking the most active moments and call-to-action clicks, and analyzing chat participation together with entry and exit patterns, hosts can clearly understand what keeps their audience involved. Choosing the right schedule in the middle of the week and keeping sessions focused between thirty and forty minutes helps increase participation and maintain attention, while replays and social media sharing allow the content to stay valuable long after the live session. Embracing this data-focused approach helps organizers evaluate results and keep improving content, timing, and interaction strategies for the best possible impact through webinar statistics.
FAQ
What metrics should I track for webinar room occupancy and why is that useful?
You should track the share of invited people who actually attended and see at what times the room was most full. That helps you understand which time zones or geographies bring more people and optimize invitation timing and language for future webinars.
How can I use chat history data to improve future webinars?
You can analyze chat history to see which topics interest users most and who was active, then answer unanswered questions at the next webinar or send explanations by email. This feedback loop helps you better tailor content next time.
Why is analyzing entry and exit history important and how is it done?
It gives you the exact number of participants at any moment and how many joined or left. You can also download these logs in XLSX or CSV format. This insight helps you see drop-off patterns over time.
What does "Call To Action" statistics tell me and how can I use them?
It shows the ratio of attendees to clicks on a button (for example, a "buy now" or "download" button) and statistics per each specific button. You can then see which buttons worked best and adjust their placement or wording.
What general webinar trends or "benchmarks" are worth knowing?
Midweek tends to attract more participants, webinars of 30 to 45 minutes are more preferred, on average only 40% of people stay till the end, and a recording keeps drawing views for a while after the broadcast before interest fades.